Profit
Profit from shares or total share return (TSR) for period i is calculated by
\[r_i = TSR = \frac{d+(P_i-P_0}{P_0}*100\%\]
where
Market adjustment return (accounts market return - \(k_m\)).
\[MAR = \frac{1+TSR}{1+k_m}\]
\(k_m\) could be risk-free instruments or market index
Oportunity adjustment return (accounts profit of compalien fron the same field)
\[OAR = \frac{1+TSR}{1+k_s}\]
\(k_s\) - return in the company field
Risk
Share risk is measured by standard profit deviation (\(\sigma\)) or by coefficient of variation (cv)
Standard profit deviation is calculated as \[\sigma=\sqrt{\frac{\sum_{i=1}^{n}(r_i-r)}{n-i}}\]
where
Classical approach is to use monthly profit on five years interval (60 periods of observation)
Historical data for US market (1928-2008, 1 year interval) shows that real risk distribution is close to normal distribution
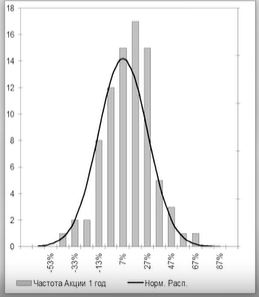
Profit probability is:
- 68.3%: \(avg\pm \sigma\)
- 95.5%: \(avg\pm 2\sigma\)
- 99.7%: \(avg\pm 3\sigma\)
Risk and Profit relationship
To account ralationship between risk and profit, Sharpe ratio is used \[S_a=\frac{r_i-r_f}{\sigma_i}\]
where
Portfolio Risk
Portfolio risk is much less than risk then risk of individual shares
For US market 20 shares is enough for diverced portfolio, for Russian market 10 shares is enough. Diversification should account shares sector (telecom, retail, etc)
Historical Data
Historical data for US market (1928-2008) is shown below
| Type | Annual Profit, % | Risk Premium, % | Risk (\(\sigma\)) |
| T-Bonds | 3.74 | - | 3.02 |
| 10-yr bonds | 5.45 | 1.71 | 7.61 |
| Stocks (D&J Index) | 10.18 | 6.44 | 19.53 |
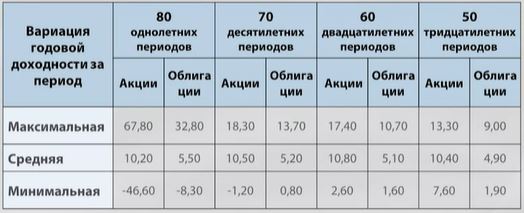
For investment perion more than ten years risk decreases dramaticaly and there were no 30 years intervals on US market so far with negative profit
Ratios
Financial results could be found here https://finbox.com/NYSE:JNJ/financials/balance_sheet
- P/E - price over earnings. High value shows that company has high share price. Earnings are very unstable paremeters
- P/S - Price over sales
*P/BV - Price over book values or Capitalisation over equity
In this ratio it is hard to include cost of brand, that is very important for Consumer Cyclical (Discretionary) потребительский sector and Consumer Defensive (Staples) потребительские goods. For such companies P/BV should not be used!!!
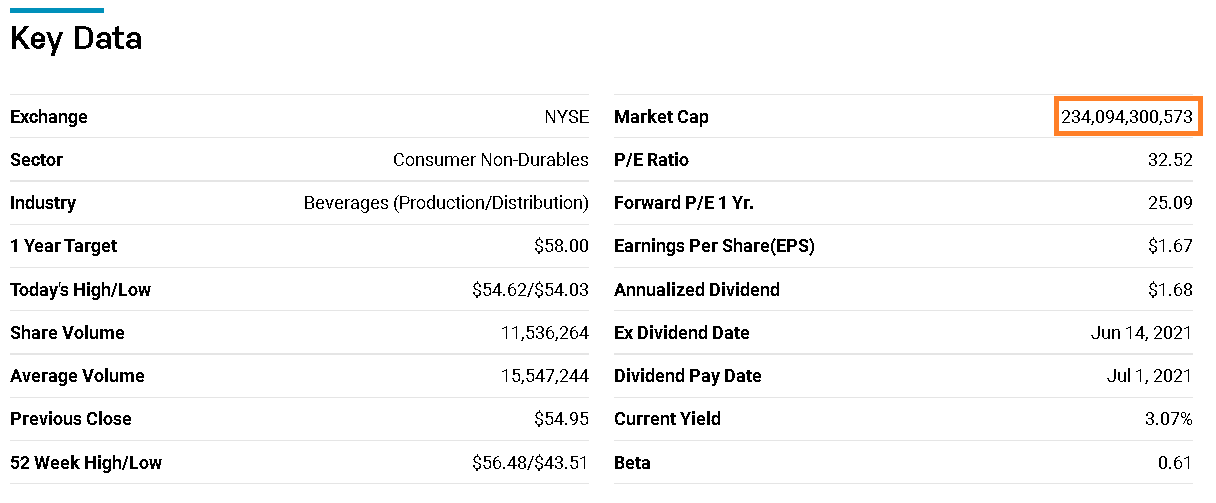
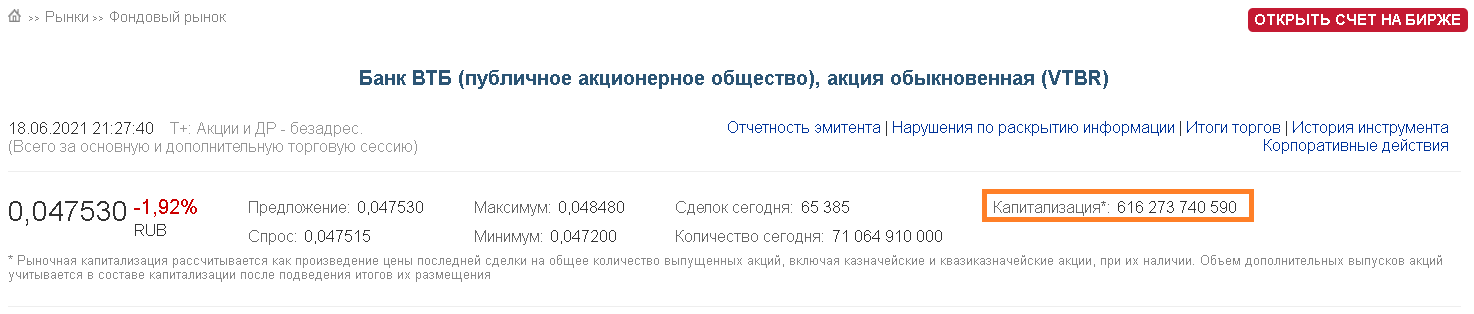
Capitalisation could be found on stock exchange sites
https://www.nasdaq.com/market-activity/stocks/ko
https://www.moex.com/ru/issue.aspx?board=TQBR&code=VTBR
Capital could be found in Statement of Financial Position
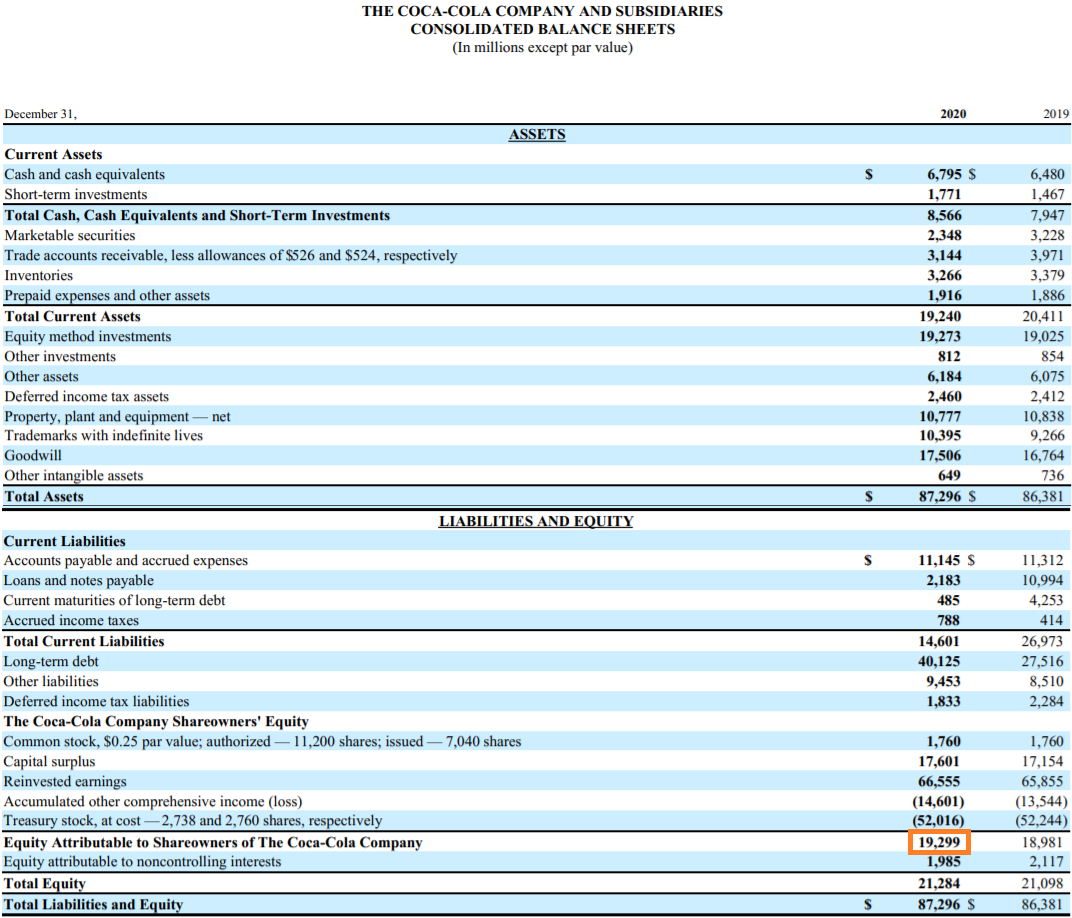
P/BV = 234 094 300 573 / 19 299 000 000 = 12,13
*Corrected P/BV - Capitalisation / ( over shareholders equity - Preferred stocks equity + Treasury stocks + R&D expenses)
Treasury stocks decrease capital however they could be nulify or sold. R&D does not account in equity, howeher they help company to get money. It is assumed that R&D investment fully lost in 10 years. So, year year company lost 10% of R&D capital
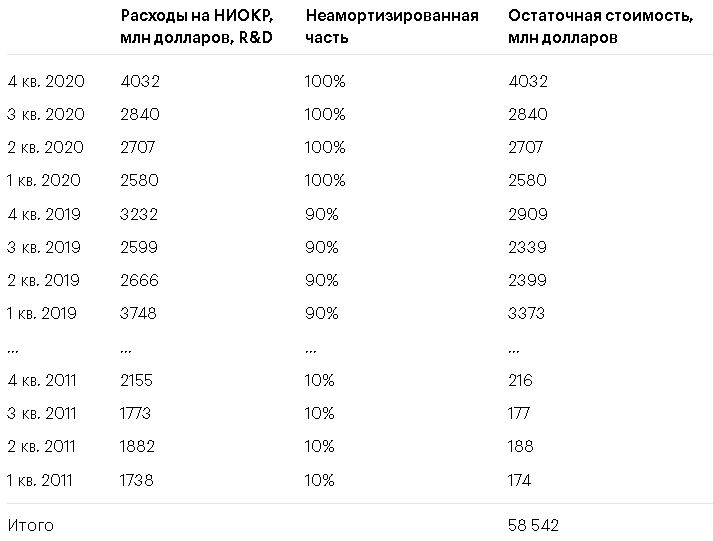
P/BV = 234 094 300 573 / (19 299 000 000 -1 + 52 016 000 000) = 3.28
* ROA
Return on assets= EBIT / Assets.
* ROC
Return on company= EBIT(1-T) / (E+D).
T - tax rate E - equity D -debt
* ROE
Return on equity = Net income to stockholders / (Total equity − Total preferred equity).
Net income to stockholders = Net income + RnD expences − RnD ammortisation.
RnD expenses are taken for the last 4 quarters of the year. RnD amortisation - for 10 years
ROE should be higher than ROA for the good company (debt rate lower than business rate)
*P / OCF
Price to Operating cash flow - is a stock valuation indicator or multiple that measures the value of a stock's price relative to its operating cash flow per share. The ratio uses operating cash flow (OCF), which adds back non-cash expenses such as depreciation and amortization to net income.
* EV / EBITDA
Enterprise multiple, also known as the EV multiple, is a ratio used to determine the value of a company. The enterprise multiple, which is enterprise value divided by earnings before interest, taxes, depreciation, and amortization (EBITDA), looks at a company the way a potential acquirer would by considering the company's debt
*VIR
VIR= TSR/(P/E) - value investment ratio. Neff cocomends to buy stocks with VIR >0.5
Sectors priority
Good idea to find best currently performing sectors is to look at BCG Ranking https://www.bcg.com/publications/2020/interactive-value-creators-rankings
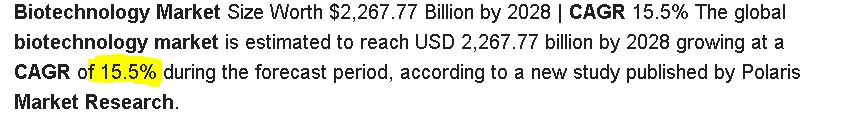
For company selection, it's good to follow international funds (ex Fidelity FDEM ETF) Also annual growth of the sector could be found using "(sector) market research CAGR"' query. The sector should grow faster than the world economy (7%)
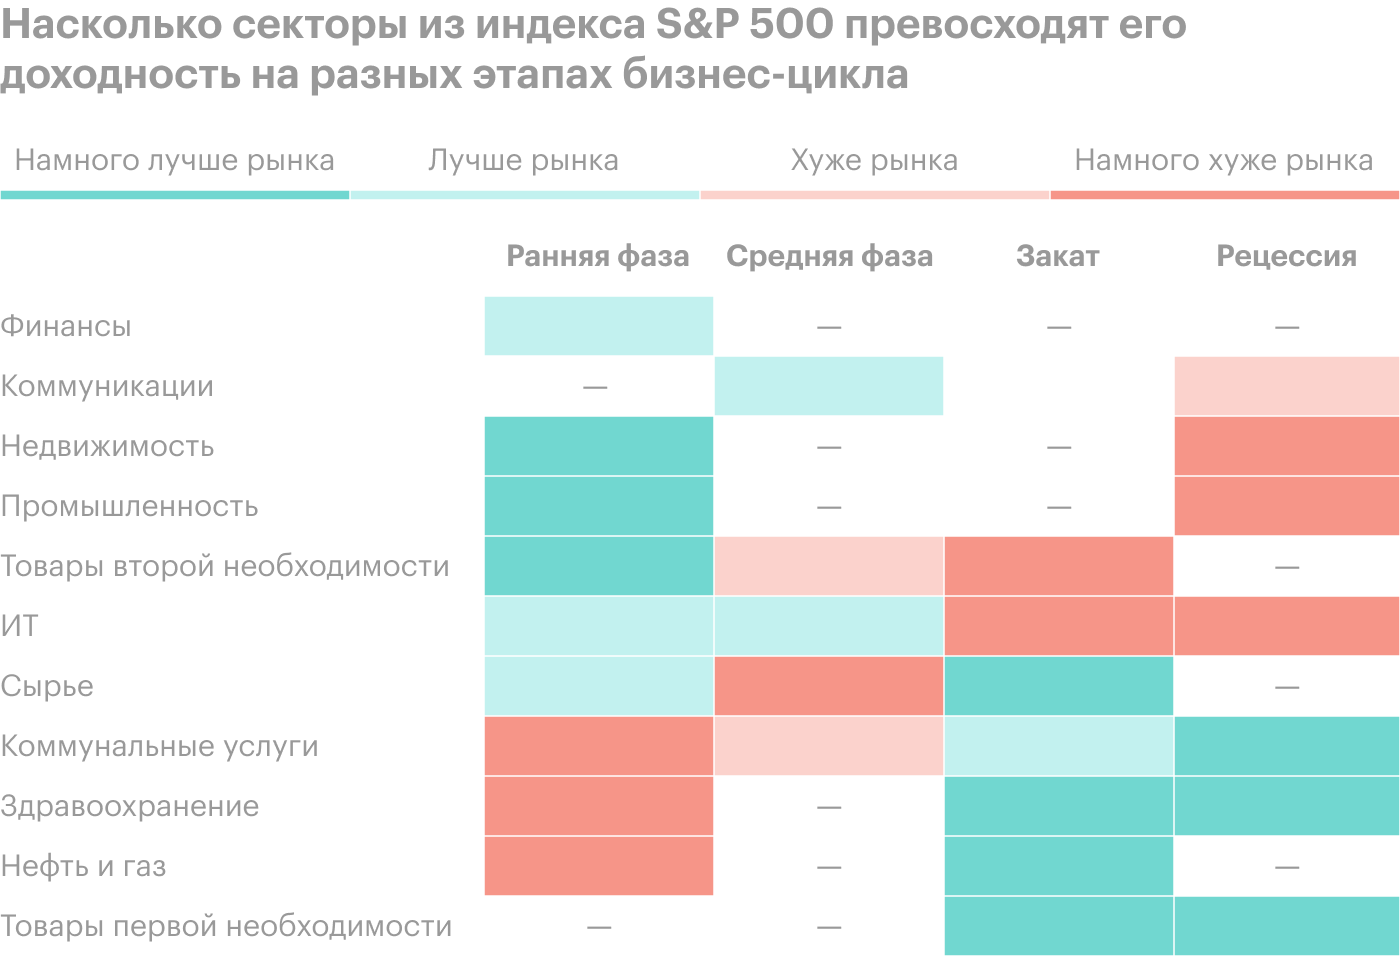
Some sectors perform better in recession, others in the market growth phase

To find companies in sector use the following sources
- https://finviz.com/screener.ashx - US companies by sectors
- http://stockchart.ru/MarketMap - Russian companies by sectors
It is important to consider economy cycle while picking shares Attach:economy_cycles.png
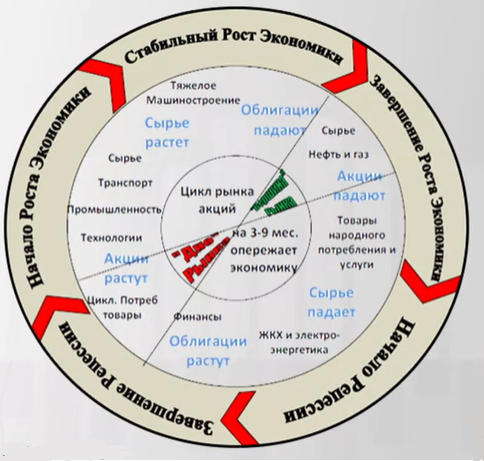
Insiders
Insiders understand company busyness is much better than most people. They should report about their operations with company stocks. The following sites could be used to monitor their operations:
- http://openinsider.com/screener - US market
- https://invest-idei.ru/insider-radar - Russian market
Selling stocks is not very reliable indicator. Person could sell stocks to buy a home or to pay for kid's college. Purchases are much more interesting, especially when they irregular, involve different officers (cluster deal), and on a large sum (more than $10k).
Officers' deals are better indicators than the board or large investors
Market Bubbles
After a bubble shares could heavily drop. So it's better to avoid overheated markets. If average broad market index ratios are higher than average it could indicate a bubble
| Ratio | SnP avg | Moex Avg |
| Current P/E | 18.91 | |
| Shiller P/E | 19.63 | |
| MCap/GDP | 106% | |
Stock valuation methods
Present value of a perpetuity
\[PV=\frac{A}{i}\] where
Gordon model
\[PV=\frac{A}{k-g}\] where
3 projections method
We are interested in companies that meet the following criteria
- That generate profit higher than the price of money (ROC>WACC)
- That FCF grow faster than the average company in the industry
- That have reasonable amount of debt (NDR < 3)
3 Growth rules
Sales should grow faster than assets
Profit should grow facter than sales